Posted in
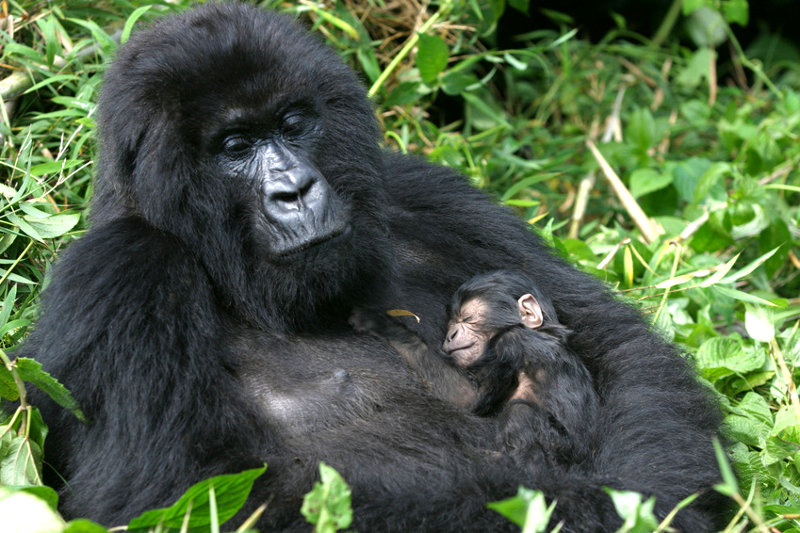
Periodic censuses of endangered populations of high-profile species help us to understand their population dynamics, to assess the success of conservation programs aimed at ensuring their survival, and to ensure that they received continued attention from the global conservation community.
Mountain gorillas are a highly endangered sub-species of primate, living in just two populations in the Virunga Volcanoes, spanning the borders of Rwanda, Uganda and the Democratic Republic of Congo, and in Uganda’s Bwindi Impenetrable National Park. Both Bwindi and the Virungas are small islands of forest, surrounded by some of the highest rural population densities in Africa. The forests have suffered from considerable human impact in the past, in the form of timber extraction, gold mining, encroachment, Gorilla Safaris and poaching. Much has been done in recent years to improve protection and management, with the creation of national parks and considerable support from international conservation organizations. However, the small size of the remaining forests, coupled with the intense pressure from the surrounding population, still presents considerable challenges to the park managers. Continued immediate threats to the forests and their wildlife include illegal use of forest resources (poaching, pitsawing, firewood collection etc.), encroachment and demand for land, human-induced fires, invasive exotic species and human-wildlife disease transmission. In addition, past hunting and logging still has an impact on the forest, with greatly reduced canopy cover and few large herbivores left. These current and historic threats raise questions about the ability of these islands of forests to survive and regenerate in the long term, and emphasise the importance of close monitoring of the forests and the endangered wildlife populations which they support.
The Virunga gorilla population has been the subject of much research and several censuses over the last 30 years (Weber and Vedder 1983; Harcourt et al. 1983; Vedder 1986; Sholley 1991). Most recent census have found that the population is increasing, despite over a decade of insecurity in the area (Kalpers et al. 2003; Gray et al. in prep). The Bwindi population, however, is less well known. Intensive ecological and behavioural research has only been carried out over the last few years. The earliest surveys estimated the population at less than 200 (Schaller 1963; Harcourt 1981; Butynski 1985), but these were not based on complete counts and could be underestimates. Butynski (pers. comm.) attempted to monitor all groups over a seven year period up to mid-1993, during which time the population remained stable at around 300 individuals (Butynski & Kalina 1993). The only full census of the population, using the complete count “sweep” methods developed in the Virungas, was carried out in 1997. This census established a total population of 300 gorillas and tentatively concluded that the population size was stable (McNeilage et al. 1998, 2001).
In general, experts consider that gorilla censuses should be carried out approximately every five years under normal circumstances. The aim of this census carried out in 2002 was therefore to assess changes in the population since 1997 in order to increase our understanding of gorilla population dynamics in Bwindi, levels of human disturbance and their impacts on the gorillas, and the effectiveness of conservation efforts.
Methods
Gorilla Census Techniques
The basic procedure employed to census the gorilla population was based on that previously used in Bwindi and the Virungas (Sholley 1991; McNeilage et al. 1998, 2001). Six teams, consisting of trackers and team leaders, traversed the park systematically from southeast to north west. The park was divided into small sectors (approx. 5 – 10 sq. km2), centred around campsites and access points. One team was assigned to census each sector, proceeding such that no more than 3 days were left between the completion of work in one sector and the beginning of work in the next contiguous sector. Where possible, teams in neighbouring sectors shared campsites, to allow better coordination of movements and comparisons of findings.
Each sector was search by walking an irregular network of reconnaissance routes across the area. When recent gorilla trail (less than 5-7 days old) was found it, it was followed until nest sites were located. The actual direction of reconnaissance routes walked was determined largely by the terrain and the availability of existing trails, while ensuring that the routes were sufficiently dense so that no area was missed which could have been large enough for a gorilla group to spend more than one week in it. In order to achieve this, the distance between adjacent trails was never greater than 500 to 700 m. Using the topographic maps, along with GPS, compass and altimeter readings, each census team mapped as accurately as possible all paths taken and gorilla trails followed. GPS readings were taken every 250 m along the trail, to ensure that it could be accurately mapped. By covering the area in this way, mapping and dating all gorilla trails and nest sites, and by marking nest sites encountered with cut stakes, it was possible to ensure that all groups were found and that none was counted twice, and to distinguish similar sized but distinct gorilla groups found close to each other.
At each nest site, nests were counted and dung size measurements, along with the presence of silver hairs, were used to establish the age-sex composition of the group. Teams aimed to find at least three nest sites for each group to confirm the composition of each group, since individual nests or dung could be missed at one nest site. Dung size classes used were as follows:
Adult male (SB): > 7.2 cm (with silver hairs)
Adult female or blackback male (MED): 5.5 – 7.2 cm Juvenile/sub adult (JUV): < 5.5 (sleeping in own nest) Infant (INF): generally < 4cm (sleeping in mother’s nest)
Juvenile and sub adult categories were combined, since previous experience indicated that dung sizes do not give sufficiently precise information to distinguish three categories (adult, sub-adult and juvenile). Young individuals constructing their own nest were always considered here as the combined category juveniles/subadults, and not infants. In the absence of infant dung, adult female nests could not be distinguished from those of a comparable sized subadult (blackback) male.
Dung of young infants (less than approximately one year old) is rarely found in nests, and so the number of infants in the population is underestimated by these methods. However a correction factor can be calculated for this, based on the fact that previous censuses of groups with known composition have shown that approximately one third of infants are missed in this way, i.e. for every two infants found, another one will have been missed. This correction was applied to the total number of infants in un habituated groups.
Survey Methods for Human Disturbance
The reconnaissance trails walked while looking for gorilla trail covered a large portion of the park, and provided an excellent opportunity to collect data on signs of human impacts within the forest, as well as other large mammals (data on which will be presented separately). While walking these trails, signs seen of human use were recorded, with the GPS location and estimated age of each. These included snares, pitfall traps, human tracks, poachers’ camps, pit-sawing sites, building poles, firewood and bamboo cutting. Age was categorised as “recent” < 3 months, “old” > 3 months, and very old> 10 years. The category very old was only used for pitsawing sites, which are visible for many years. Signs classified as very old probably predated the gazetting of the park. These survey methods were the same as those used during the 1997 gorilla census, so that direct comparisons could be made in the frequency and distribution of signs of human disturbance over this period.
Signs were analysed as encounter rates per km walked, which required an accurate estimate of the distance travelled by each census team. Distances were measured for 179 out of 199 reconnaissance trails in this way. However, for the remaining 20 trails, the hipchain machines broke, or thread supplies ran out while the teams were in inaccessible places. Distances for each trail were also estimated from the sum of the straight line distances between each consecutive GPS reading taken on that trail. Distances measured for GPS were closely correlated with distances measured on the ground using the hipchains. (pearson’s correlation coefficient r = 0.985, p<0.0001), and consistently underestimated the hipchain distance by around 10%. The GPS distance estimations, corrected for this underestimate, were therefore used where hipchain distance measurements were not available. Total distance walked on each reconnaissance trail was measured using a hipchain (Topofil) with biodegradable thread. Trails walked, animal signs and human use were also recorded separately within and outside multiple use zones, where these occur in some of sectors of the park, to allow comparisons between multiple use and non-multiple use
areas.
Results
The five habituated groups in Bwindi contained a total of 72 individuals at the time of the census. In addition to these, 22 unhabituated groups were found along with 10 lone silverback males, giving a total uncorrected population count of 298 individuals (Table 1). A total of 33 infants were counted in the unhabituated groups, so that we predict that another 17 would have been missed because they were too young for their dung to be visible in the nests. This brings the corrected total to 315 individuals, and as with the previous census in Bwindi, we round this figure up to 320 as our best estimate of the population size, since experience shows that a small number of small groups or lone silverbacks can be missed with these methods.
While the total population size has increased slightly, the other population parameters, group size and percentage of immatures (infants plus juveniles) in the population, are comparable with those found in 1997 (Table 2). The number of lone silverbacks found increased from 7 to 10, but these individuals are particular difficult to find
The location of groups found during the census is shown in Figure 1. As with the 1997 census (shown in inset), the gorillas were concentrated towards the interior and western areas of the southern sector of the park. As with all previous surveys, no gorillas were found in the northern sector. Signs of human disturbance were generally more frequent during this census than in 1997 (Figure 2). The distribution of human disturbance, however, was similar (Figure 3). As with the 1997 census, gorillas tend to be found in areas of relatively low human disturbance, and in fact this pattern appears to be more clear in 2002.
Conclusions and discussion
This census found that there has been a small increase (approximately 7 %) in the size of the Bwindi mountain gorilla population since 1997. While this is certainly good news from a conservation perspective, the small size of the increase means that we would need to find further increases over time to confirm that there really is an upward trend. Under optimal conditions, gorilla populations are capable of growing at 3 – 4 % per year (Miller et aI., 1998; Robbins & Robbins, 2004; Steklis & Steklis, 2001), suggesting that certain factors are limiting the Bwindi population. Possible constraining factors include the availability of aood (]orill::!
gorilla beringei (eds S. Werikhe, L. Macfie, N. Rosen and P. Miller), pp. 71-105. IUCN/SSC Conservation Breeding Specialist Group, Apple Valley, Minnesota.
Robbins, M.M., Robbins, AM. 2004. Simulation of the population dynamics and social structure of the Virunga mountain gorillas. Am J Primatol. 63: 201-223.
Schaller, G.B. (1963) The Mountain Gorilla: Ecology and Behaviour. University of Chicago Press, Chicago.
Sholley, C.R. (1991) Conserving gorillas in the midst of guerrillas. American Association of Zoological Parks and Aquariums, Annual Conference Proceedings, 30-37.
Steklis, D. and Gerald-Steklis, N. (2001) Status of the Virunga mountain gorilla population. In Mountain Gorilla: Three Decades of Research at Karisoke (eds M.M. Robbins, P. Sicotte and K.J. Stewart), pp. 391-412. Cambridge University Press, Cambridge, UK.
Vedder, A (1986) Virunga mountain gorilla census. Co-ordinator’s report. WCS, New York. Weber, AW. and Vedder, A (1983) Population dynamics of the Virunga gorillas 1959-1978.
Biological Conservation, 26, 341-366.